What we need to see
The decisions you need to make, source reports and definitions of the numbers your team currently disagrees about.

Operational analytics · Fabricators
Fabrication margin is built one job at a time and lost ten ways at once. Slippage on schedules, drift on labour hours, hidden material variance, late deliveries that ripple through. Live operational analytics put the real numbers in front of you when decisions can still be made.
Tell us the task, your current tools and where the work gets stuck. We will help you choose a sensible first scope.
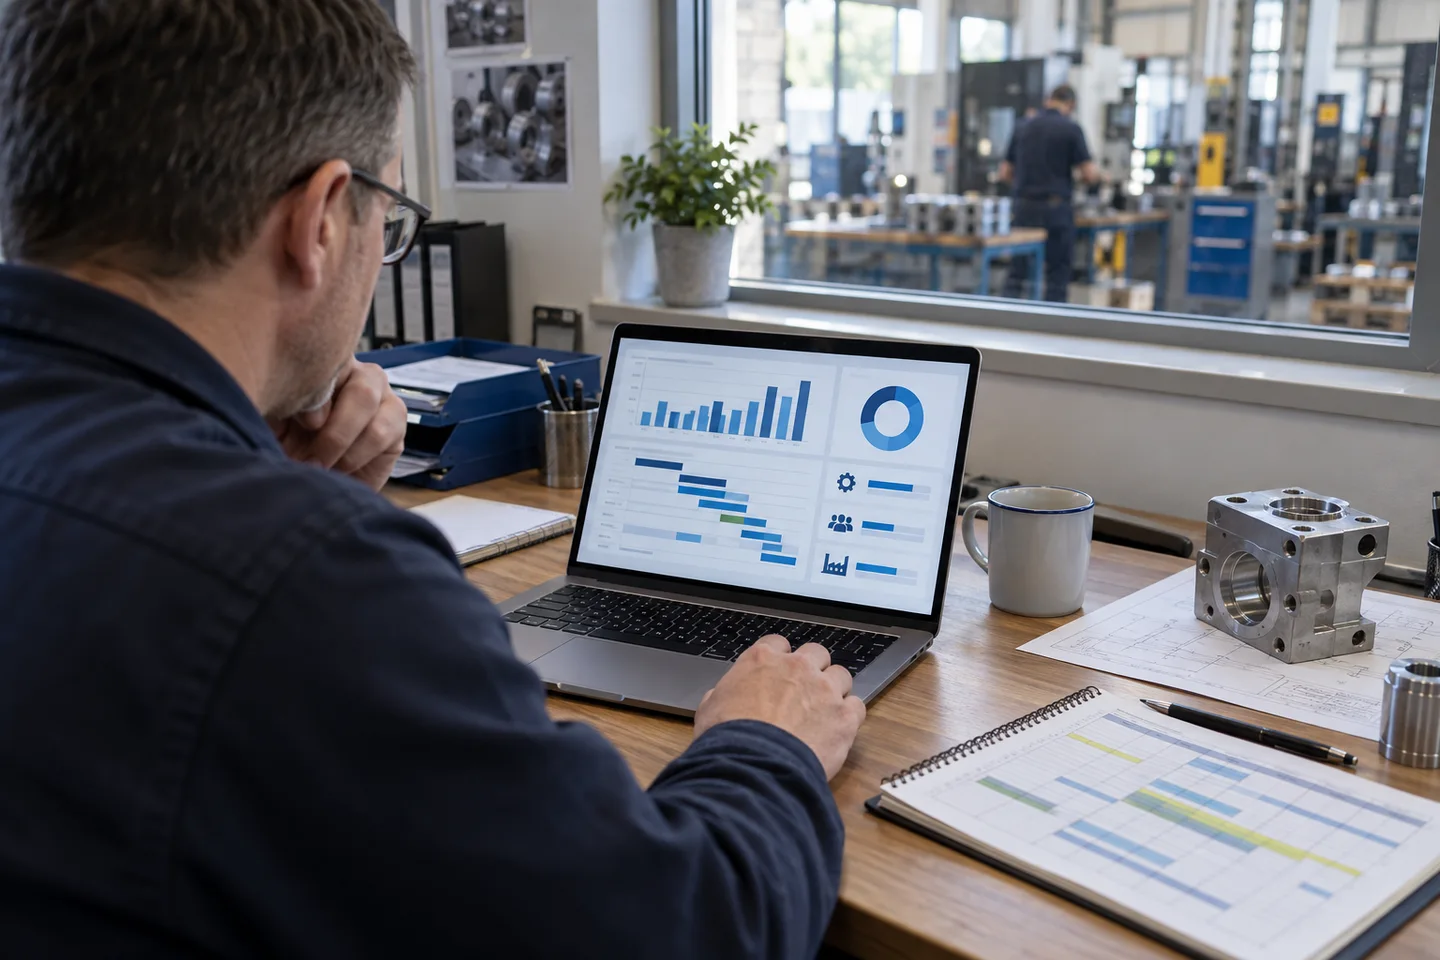
You see margin slipped at month-end. By then, the cause is buried under 100 jobs. Was it material costs? A bad customer mix? Labour drift on a few big jobs? You need a person to spend two days digging through three systems, by which point next month's margin is already happening. The decisions that matter happen Tuesday afternoon, not Friday morning.
The work in context · Illustrative scenes
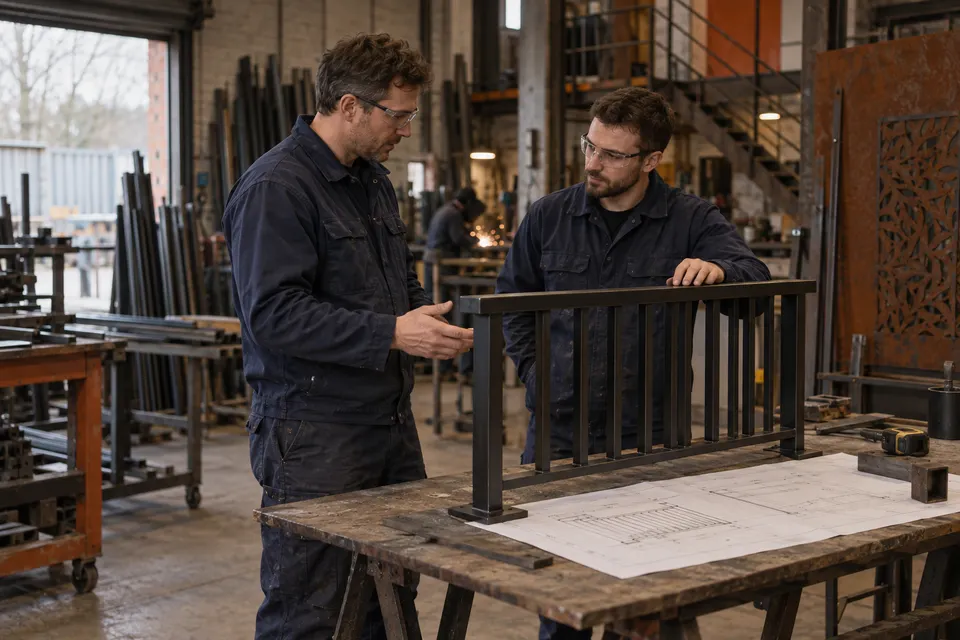
Use representative inputs from the business to scope operational analytics. Agree what the system prepares and what a person needs to check.

Test normal work, missing information and failures with the team, then hand over clear review steps and practical guidance.
See the business context and the work delivered. Your own scope, inputs and results will depend on the workflow we agree with you.
Explore the delivered workData from MES, accounts, supplier portals into one warehouse. Reconciled, defined consistently, refreshed in real or near-real time.
What's shipping today. Which jobs are at risk. Which customers are slipping in spend. Where capacity is bottlenecked. Designed around the role, office manager sees scheduling; commercial director sees margin; production manager sees throughput.
For everything not on a dashboard: a natural-language query interface. "What did we ship to Acme last quarter?" "Which jobs ran more than 20% over estimate?" Answers in seconds.
Margin trending below target. A customer who hasn't reordered. A job 3 days late with no flag raised. The system pings the right person before it becomes a fire.
We check your software version, available API or export, access permissions and any supplier fees before quoting. If a reliable connection is not available, we will explain the practical alternatives.
The decisions you need to make, source reports and definitions of the numbers your team currently disagrees about.
Reconcile a sample of dashboard figures back to source records and verify update frequency before using alerts.
Show data freshness and known gaps. Managers check the underlying records before consequential decisions.
£4,800-£15,000 for build, ~£200-£500/month for hosting + maintenance
From £4,800excluding VAT
Operational analytics for fabricators
Power BI is for analysts to build reports. We build for operators, dashboards designed around real decisions, plus an AI layer that answers questions you didn't pre-build. You can host the data in anything; the difference is the layer in front of your team.
Depends on the source. For modern systems with APIs, genuinely real-time. For Sage and older systems, typically every 5-15 minutes. We design around the data you have.
Yes. A simplified shop-floor view shows what they need: what's next, what's late, who's where. Pairs naturally with the internal AI assistant for natural-language queries.
Dashboards are designed to be modified. We hand over with documentation. The AI layer adapts to new questions as long as the data is there, no rebuild required for new ad-hoc queries.
Typically £200-£500/month at SME data volumes, covering the data warehouse, the dashboards, and the AI layer's model usage.
Keep exploring
A new website. More customers. Less admin.
Tell us where you want to get to. We will reply within one working day.